Investments
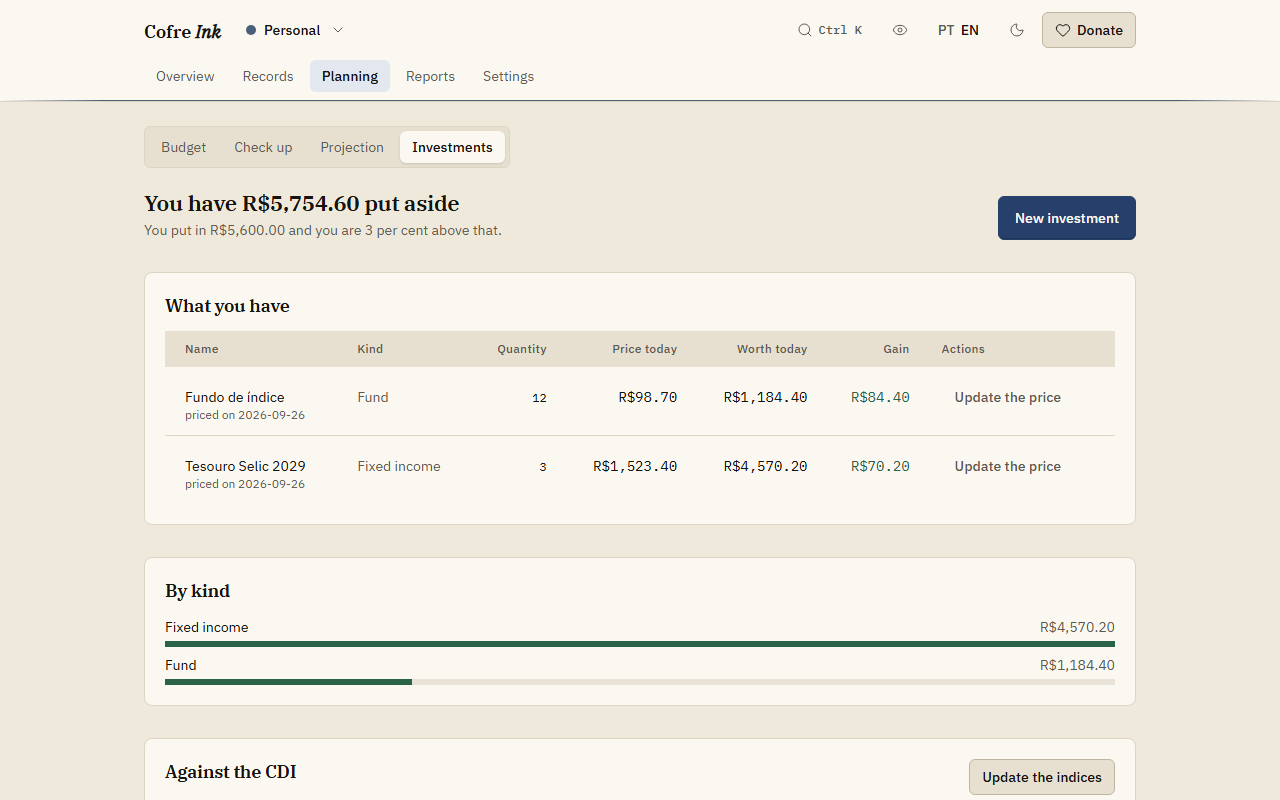
Investments keeps a list of what you have put aside, with prices you type yourself, and shows what it is worth today and how much it has gained. It can set your money beside what the CDI paid, and it has a compound interest simulator. Cofre Ink never looks up a price at a broker or anywhere else.
Where to find it
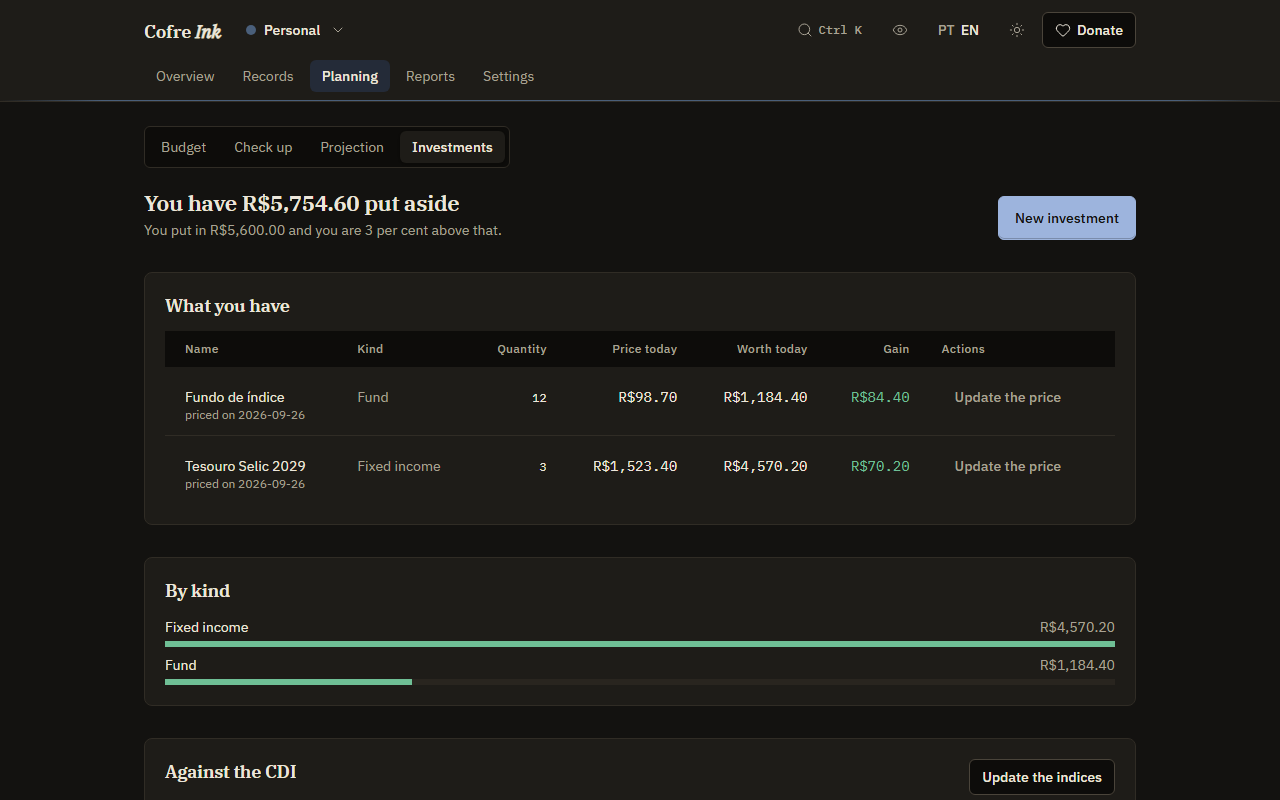
Section titled “Where to find it”In Planning, choose Investments in the row of screens under the sections.
 (opens the picture at full size)
 (opens the picture at full size)
Add an investment
Section titled “Add an investment”The space needs at least one account first (see Accounts). Without one, saving stops with Create an account first, under Accounts.
- Press New investment.
- Type a Name, such as “Treasury bond 2029”.
- Choose the Kind: Fixed income, Fund, Share, Property or property fund, Crypto, Pension or Other.
- Choose In which account it is kept. Usually an investment account, but any account works.
- Type the Quantity. It starts at 1 and takes fractions of a unit.
- Type the Price today of one unit.
- Type What it cost in total, if you know it. Left empty, it is taken to have cost what it is worth today, so it starts with no gain.
- Press Save.
The holding appears under What you have, with Worth today (quantity times price) and Gain (worth today less what it cost). The headline adds everything up, and By kind shows how it splits. Adding a holding writes no record and does not change the account’s balance: the account only says where it is kept.
Update a price
Section titled “Update a price”- In the holding’s row, press Update the price.
- Type the new Price today of one unit.
- Press Save.
The new price is dated today, and the date of the latest price shows under the name, after priced on. Each new price is kept in a history, but this screen shows only the latest one.
Compare with the CDI
Section titled “Compare with the CDI”The panel Against the CDI appears once there is at least one holding, with the Update the indices button. Until the numbers are fetched it says I do not have the indices yet.
- Press Update the indices.
- Read the chart: the CDI line is what the money you put in would be worth had it earned what the CDI paid each month, and Yours is what your holdings are worth.
- The line Indices up to a month, fetched on a date, says how recent the numbers are.
The comparison is a rough guide. It applies the CDI to what your holdings cost in total, over the stored months (at most 24), and Yours is a straight line from cost to today’s value, because the form has no purchase date and the only prices are the ones you typed.
The button fetches three monthly series from the public SGS service of the Banco Central: the CDI, the Selic and the IPCA. Each press asks for the months from January of the current year onwards, and what was fetched in earlier years stays stored. The CDI draws this chart. The IPCA feeds one of the findings: once twelve months of it are stored, the finding about money kept beyond three months of cover also says what a year of inflation takes from it. Since each press reaches back only to January, twelve stored months take presses in two different years. The Selic is stored, but no screen shows it.
The request asks for a public table, carries none of your records, and happens only when you press the button, never on a schedule. It needs a connection at that moment. Who makes it depends on the mode:
- In browser mode, your browser asks the Banco Central directly and keeps the numbers in its own database, so the chart still shows with no connection.
- In server mode, your Cofre Ink server asks and keeps the numbers, and one update serves everybody who uses that server.
Try the simulator
Section titled “Try the simulator”The Compound interest simulator sits at the bottom of the screen, even with no holdings. It starts from what your holdings are worth now.
- Type Putting aside each month. It starts at 500.
- Type Earning a year, as a percentage. It starts at 10.
- Type For how many years, from 1 to 50. It starts at 10.
The chart and the sentence under it change as you type: how much you would have, and how much of it came from growth. Nothing here is saved.
When your holdings have a value and the Projection expects spending this month, three more lines say how many months of your cost of living the holdings cover, how much you would need to live on what it earns (a year of spending divided by 4 per cent, a withdrawal rate fixed in the app), and whether, at the simulator’s pace, you would get there and when. It is arithmetic, not advice, and names no product.
Good to know
Section titled “Good to know”- The screen lets you add a holding and update its price, and nothing else. A holding cannot be edited (name, kind, quantity, cost or account) or deleted there, so check it before you save. Another purchase of something you already hold can go in as a new holding.
- Prices never change by themselves. Holdings are in reais.
- Investments belong to the space that is open. In a shared space every member sees them, and only an Owner, Administrator or Editor can add one or update a price.
- This screen has no Print button. Printing is on Reports and on the Projection.
For a reading of your money as a whole, including idle money, see the check up.