Reports
Reports show what one month did with your money: how much came in, how much went out, where it went and on which days. Everything on the screen is added up from the records you have already written, and the whole screen can be printed.
Where to find it
Section titled “Where to find it”Reports is one of the five sections of the navigation, across the top on a wide screen and in the bar at the bottom on a phone. It is a single screen. You can also open the command palette with Ctrl K (Cmd K on a Mac) and type its name.
 (opens the picture at full size)
 (opens the picture at full size)
Read a month
Section titled “Read a month”- Open Reports. It starts on the current month.
- To see another month, pick it in Month.
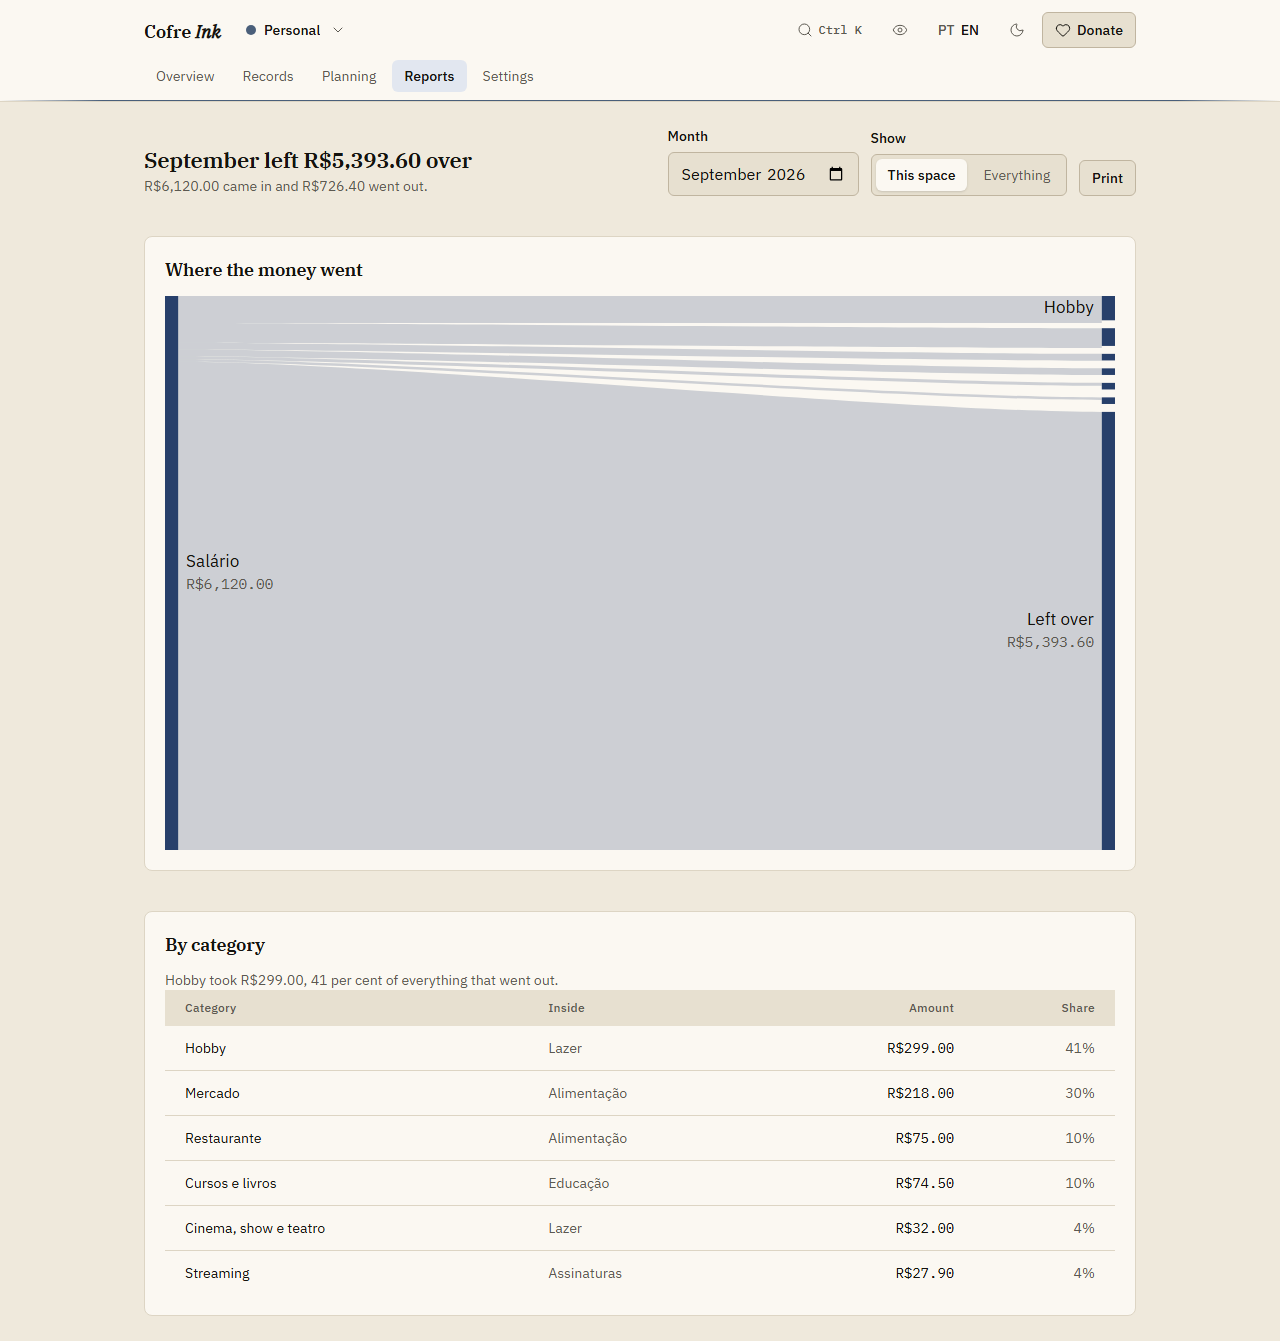
- Read the headline first. It says how much the month left over, or how much it came up short, and the line under it says how much came in and how much went out.
- Read the panels below it, described in the next section.
If the month has no income and no spending, the headline says nothing was recorded and the screen shows No records this month.
What each panel shows
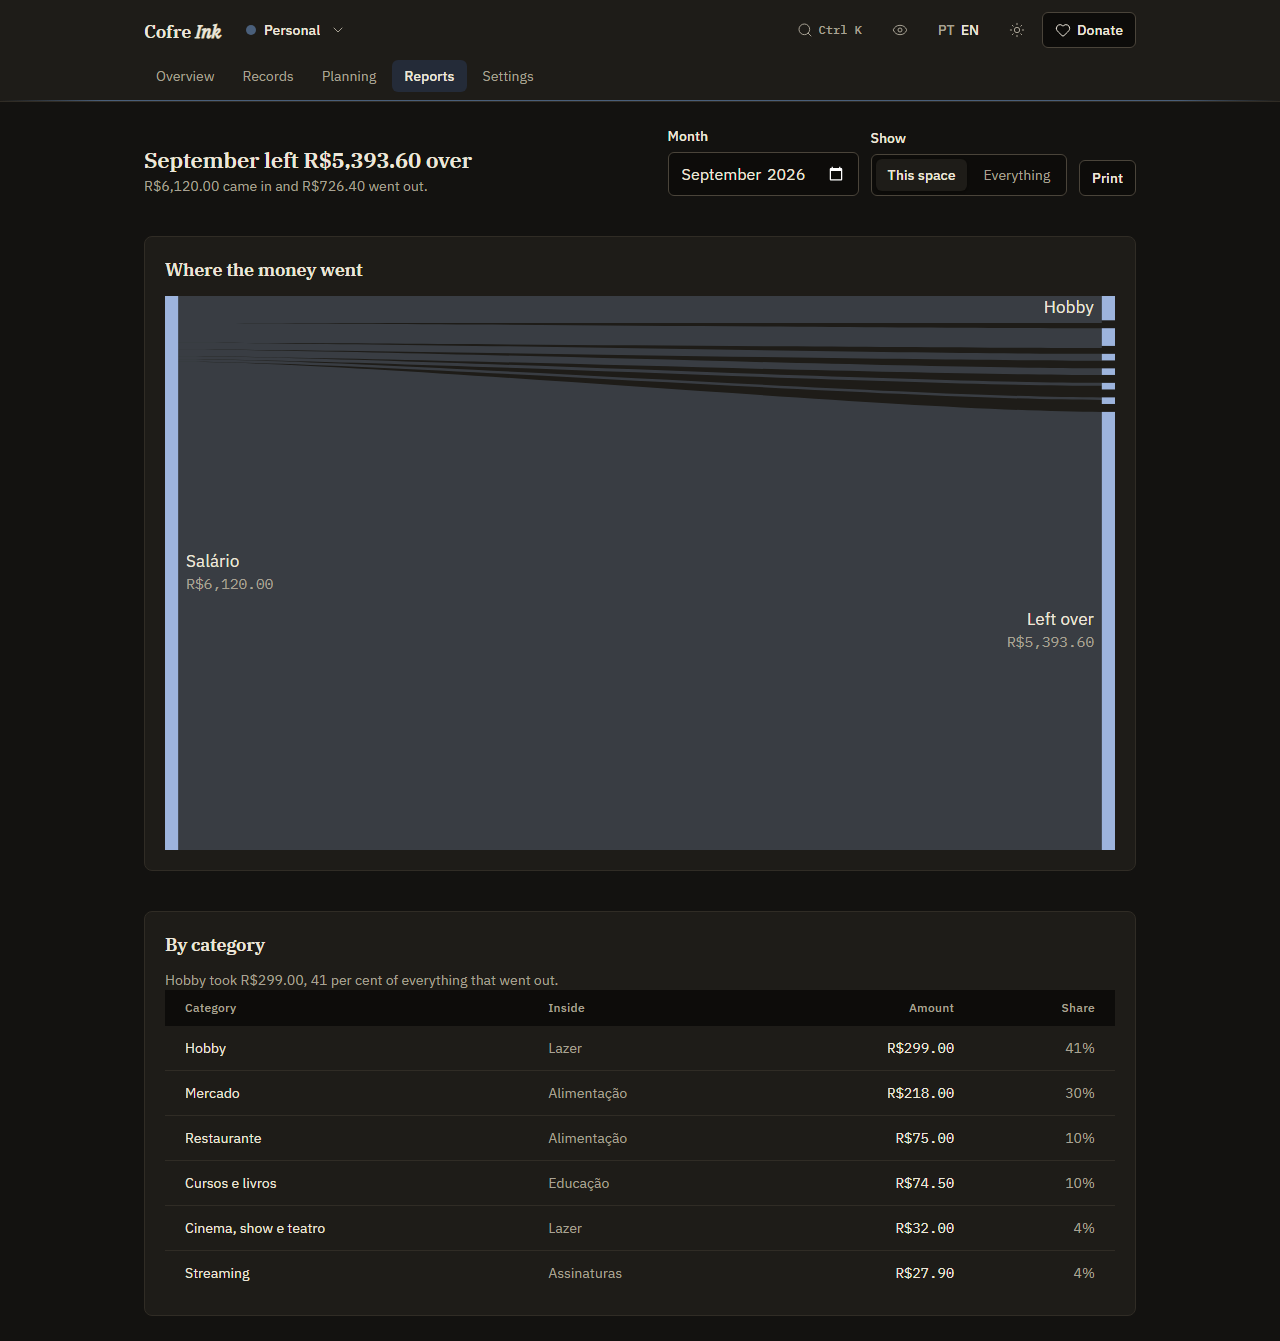
Section titled “What each panel shows”- Where the money went: a diagram with what came in on one side, by category, and what went out on the other. What the month did not spend appears on the out side as Left over. When the month spent more than it earned, the difference appears on the in side as Came from savings. On a phone the diagram becomes two lists, In and Out.
- By category: a sentence naming the category that took the most, and a table with Category, Inside (the parent, for a subcategory), Amount and Share. Spending with no category is a line of its own, No category.
- By priority: how much went to Essential, Important, Desirable and Superfluous (and No priority), and what share of the spending was desirable or superfluous. A priority set on the record itself counts over the one of its category.
- Which days money leaves: the month as a grid of days, Monday first, each day darker the more was spent. On a computer, point at a day to see its total.
- The last twelve months: columns of In and Out for the chosen month and the eleven before it (a month with nothing recorded does not appear), with a table of Month, In, Out and Difference, newest first.
See every space together
Section titled “See every space together”When you have more than one space, a Show switch appears next to Month. Choose Everything to add up every space you can open, or This space to go back to the space that is open. With a single space the switch does not appear.
Print a report, or save it as PDF
Section titled “Print a report, or save it as PDF”- Choose the month, and This space or Everything.
- Press Print. Your browser’s print dialog opens.
- Print on paper, or pick the option to save as PDF that your browser offers in that dialog.
On paper the header and the controls are left out, the page comes out in dark ink on white whatever theme you use, and a line at the top names the space (or Everything), the month and the year. Cofre Ink does not write PDF files itself: the PDF comes from your browser. The Projection screen has the same Print button.
Good to know
Section titled “Good to know”- Reports count only what has happened. A record marked Has not happened yet is left out until you press Mark as paid on it.
- Transfers between your own accounts are neither money in nor money out, so they do not show here.
- Reports only read your records. To change a number here, change the record in the list of records.
- The screen works the same way in browser mode and in server mode.
To set limits for the month, see Budget. For a reading of several months at once, see the check up. Priorities are set on categories and on each record.